

From the dataset, Aug 17 to Nov 15, 2026.
- Median open rate: 48.5%
- Middle half: 44.8% to 53.9%
- Median click rate: 5.3%
- Lists under 5,000 click at 6.8%; over 10,000 at 4.2%
Pew, INN and the big email platforms tell you who reads newsletters and how media newsletters perform overall. None of them publish open rates, click rates or cost per subscriber for local newsletters.
So we put every public number in one place, then filled the gaps with an anonymized dataset from 20+ local newsletter brands and 175k+ subscribers. No newsletter in the dataset is named, and every dataset number is a median, a range or a pooled total.
From the dataset, Aug 17 to Nov 15, 2026.
Platform-wide benchmarks, no local breakout.
Closest publisher data we could find.
Pew Research Center surveys, 2025.
INN Index, nonprofit news outlets.
Company figures and press reports.
300+ new subscribers in the last 90 days.
Under 50 new subscribers in the last 90 days.
People move, change email addresses and drift away.
24 newsletter-signup campaigns, Dec 2025 to Nov 2026.
Figures operators have shared publicly.
For comparison.
Nieman Lab, December 2025.
Company figures.
Reuters Institute and Press Gazette, 2026.
About 62% of new local subscribers finish a welcome survey right after they sign up (median across 10 local newsletters). About 2 in 3 own their home, and about 1 in 10 own or help run a local business.
We looked for these in every source on this page and found nothing local: open and click rates by list size, cost per subscriber across a set of local Meta campaigns, how fast a list shrinks without new signups, and welcome survey completion.
Public sources: Pew Research Center (local news fact sheet, Apr 2026; news newsletters, Feb 2026), INN Index 2025 and 2026, Nieman Lab (Oct and Dec 2025), Press Gazette (May 2026), Reuters Institute Digital News Report 2026, Google News Initiative (Reach plc, 2024), Omeda (H1 2026), beehiiv State of Newsletters 2026, MailerLite, Kit, Mailchimp, and figures 6AM City and Ottawa Lookout have shared publicly. 2023 figures are the latest those companies published.
The dataset: local city and county newsletters run by or with the local media HQ team, across 20+ brands and 175k+ subscribers. Email stats are publication-level open and unique click rates from beehiiv, Aug 17 to Nov 15, 2026; newsletters that did not send in that window were left out. Ad costs count only campaigns optimized for a newsletter signup, with cost per subscriber as total spend divided by tracked website signups. Survey data comes from greetform welcome surveys over the same 90 days.
Open rates on every platform include Apple Mail privacy opens, so compare the gaps, not the decimals. We refresh this page every January.
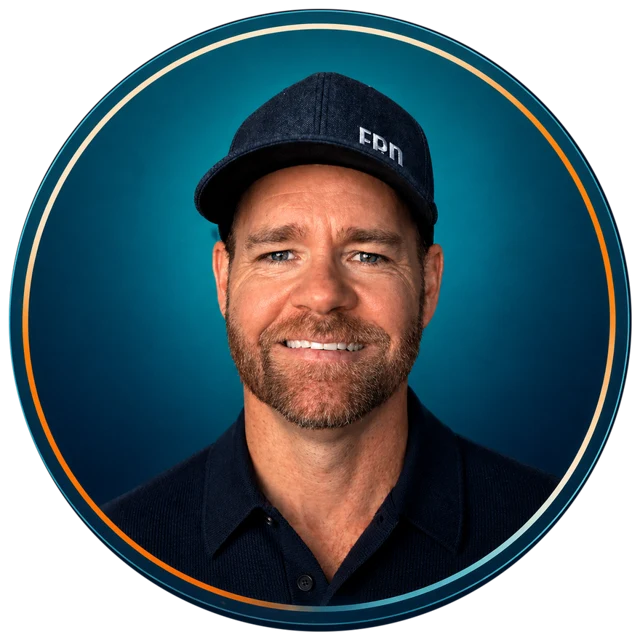
TJ runs 20+ local newsletters with 175k+ subscribers and hosts the local media HQ Podcast. This report pulls together the public numbers he kept looking for, plus the ones only an operator has.
Every operator's numbers stay anonymous and only show up inside medians and ranges. It takes about a minute.
Contact us
Ask about strategy, Meta ads, our software or AI for your local media business. Fill out the form and a real person on the local media HQ team will get back to you.